In November, several trends became clear in the luxury housing market.
First, Brunswick County is gaining popularity among high-end buyers, leading the Cape Fear region to its most profitable November ever recorded. It significantly outpaced sales in New Hanover and Pender Counties. The number of luxury transactions, with a price tag of $1 million, doubled in Brunswick compared to November 2022. Last year, 14 homes were sold in Brunswick County for a total of $21.1 million. This year, that number skyrocketed to 27 luxury sales, totaling $42.7 million.
The second noticeable trend in November is that luxury buyers are entering negotiations with more leverage. A total of 48 luxury homes were sold last month, with a collective price tag of $76.6 million. At closing time, buyer agents successfully negotiated with sellers, bringing the total final price down by $3 million to $73.6 million.
The most significant trend of the month, which could have broad implications going forward, is that luxury inventory has returned to more traditional levels. Currently, there are 320 luxury properties on the market, compared to only 213 luxury homes at the same time last year, indicating an increase of more than 50% year over year.
“Buyers are now in a position where they can fall in love with multiple properties, giving them more negotiating power,” said Scott Saxton of Just For Buyers Realty. “With inventory at these levels, we can come to the table and say, ‘Here is our offer, and if you don’t like it, there’s another home nearby that we like just as much.'”
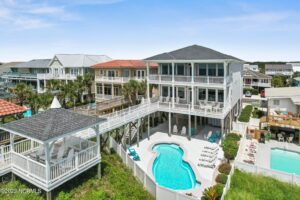
The most expensive home to sell in November is a six-bedroom property in Ocean Isle Beach. This oceanfront home on 229 West First Street measures 4,100 square feet. The property, listed by the Frances Warner Real Estate Group with Coldwell Banker Sea Coast Advantage, was on the market for 40 days before going under contract. The home closed on November 13th for $3,025,000.
| New Hanover County
Nov 2023 / Nov 2022 |
Brunswick County
Nov 2023 / Nov 2022 |
Pender County
Nov 2023 / Nov 2022 |
||||
| Newly Listed | 35 | 22 | 45 | 18 | 9 | 2 |
| Went Under Contract | 21 | 10 | 25 | 11 | 5 | 8 |
| Closed # Homes Sold | 13 | 30 | 27 | 14 | 8 | 3 |
| Total Closed $ Volume | $19.4M | $50.1M | $42.7M | $21.1M | $11.8M | $3.7M |
| Total Current Listings | 126 |
86
|
156 | 92 | 38 | 35 |